Introduction
This protocol describes the general steps for using the Emulate Chip-R1 Basic Research Kit.

This protocol describes the general steps for using the Emulate Chip-R1 Basic Research Kit.
Version 1.0 (Release Date: March 2022)
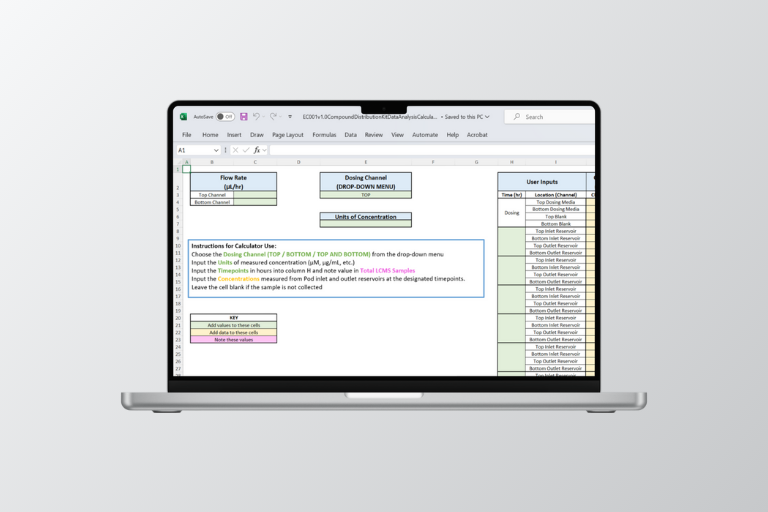
These Compound Distribution Kit analysis tools simplify assay preparation and data analysis for the Emulate Compound Distribution Kit (CDK) protocol, enabling users to quantify the amount of test compound loss (e.g., absorption or adsorption) ahead of a Chip-S1® Stretchable Chip experiment.
There are two Excel-based tools in the download: The Media Volume Preparation Calculator and the CDK Data Analysis Calculator. The Media Volume Preparation Calculator calculates the media volume required for the CDK assay, based on the intended flow rate, study duration, and expected re-dosing protocol. The CDK Data Analysis Calculator calculates the adjusted average cellular exposure and concentration range based on the dosing concentration.
Related Information:
Version 1.0 (Release Date: November 2021)
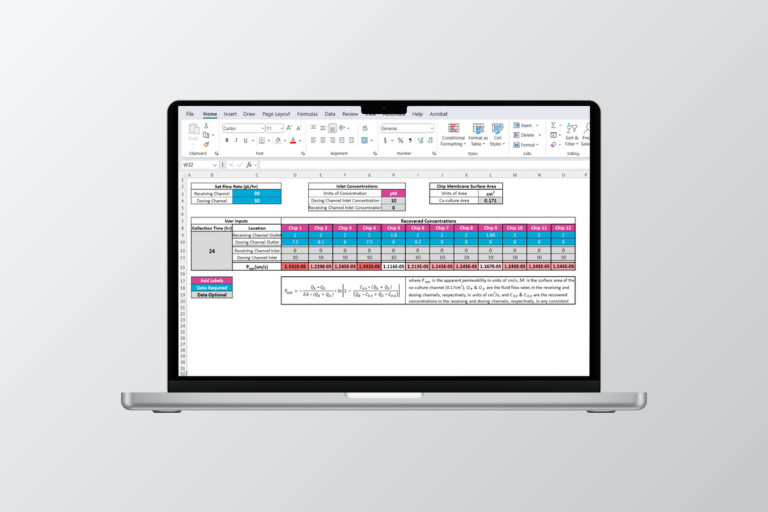
The Apparent Permeability (Papp) Calculator is an Excel-based tool that helps users calculate the permeability of the epithelial-endothelial barrier in Emulate Organ-Chips. The Papp of a molecule is determined by dosing the inlet of one channel, collecting the effluent of both channels, and calculating the amount of compound that crossed through the membrane over time. This tool can be used to help researchers streamline the process of assessing the barrier function of healthy or diseased tissues, as well as studying drug transport.
Related information:
This document provides guidance for using the Pod Imaging Adapter, which organizes Pod Portable Modules and aligns them on the same viewing axis for quick cell viability and health checks.
This is a revised version of the previously released “Basic Organ-Chip Culture” protocol (updated as of 22-Dec-2022)
This protocol covers the general process for using the Basic Research Kit.
This is a supplemental protocol which outlines the use of the new Chip Cradle. It is not intended to replace current Organ-Chip protocols, but to demonstrate how the new cradle integrates into existing Organ-Chip protocols.
This user guide contains important information to safely and effectively use the Chip Cradle. All users should thoroughly read and understand this guide before use.
The Fixed Chip Imaging Adapter organizes fixed chips for high-throughput imaging and ensures compatibility with SBS footprint advanced imaging equipment. It can also prevent evaporation for 12+ hours when used with off-the-shelf accessories.
This user guide details what is included with the kit, as well as different ways to configure the adapter to prevent evaporation for different periods.
In both in vitro and in vivo experiments, researchers must consider compound distribution within the biological model and experimental setup prior to quantitative drug studies, as distribution determines exposure — the concentration of a compound that cells truly experience.
In in vivo systems, this is addressed by volume of distribution studies, which relate compound dosage to its effective concentration. However, in both in vivo and in vitro studies, the distribution effects of system components, such as infusion tubing, syringes, tissue-culture plates, and pipette tips, are often missed.
With Organ-Chip experiments, we proactively address compound distribution in a number of ways. Several of these are embedded in our protocol designs, where we have selected experimental conditions to optimize compound exposure. Additionally, we have developed the Compound Distribution Kit to directly evaluate distribution and compound exposure.
The Compound Distribution Kit is intended to be used as a specialized control experiment — the distribution control experiment — prior to the intended Organ-Chip study. As such, the contents of the Compound Distribution Kit mirror the contents of the Organ-Chip Bio-Kit, and the protocol used for the distribution control experiment mirrors a simplified version of the intended study (e.g., without cells or ECM coating). The distribution control experiment’s output indicates whether any compound may be distributed into the system and away from cells. Moreover, in some cases, the distribution control can be used to quantitatively correct the experimental results of the intended study and assign it appropriate error bars.
Version 1.0 (Release Date: November 2021)
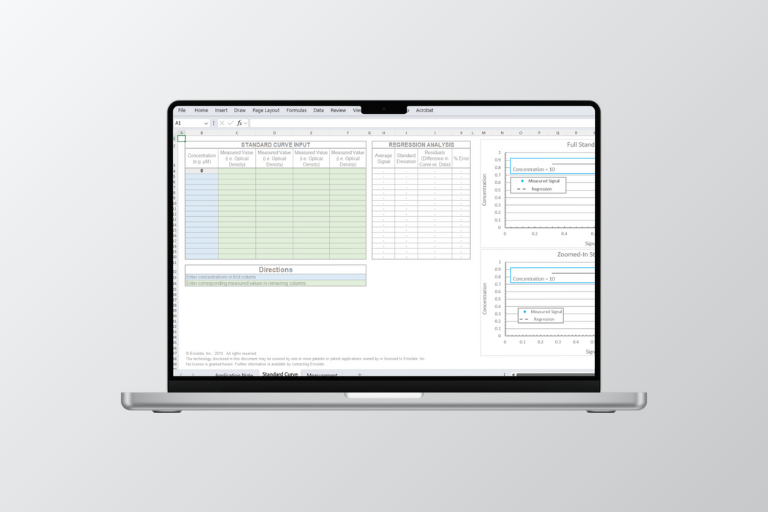
The Standard Curve Calculator is an Excel-based solution used for calculating a standard curve from raw signal measurements, such as optical density or fluorescence intensity from a plate reader assay. The conversion of raw signal intensity to a concentration (or other known readout) is performed using a standard curve. A typical use case is calculating the concentration of a given test molecule in Organ-Chip effluent. However, this calculator applies broadly to any raw readout or signal.
This assay provides a simple and sensitive method to quantify glucose levels from Organ-Chip effluent samples.